Evaluating Green IT Metrics for Microservices, utilizing the Kepler
Published:
The majority of organizations are deploying and publishing Open APIs and microservices in both public and private cloud environments. Most cloud providers are following sustainable IT practices and offering infrastructure to clients along with detailed reports on metrics such as carbon footprints.
As a software engineer and Green IT enthusiast, I am particularly interested in customized, application-specific monitoring, analysis, and visualization of Green IT metrics within self-maintained dashboards or reports.
The sustainable technology space has matured significantly, with numerous practices and tools available for various applications and domains.
For example:
- Website Carbon Calculator: A tool that calculates the carbon emissions associated with a website.
- Cloud Carbon Footprint: An open-source tool for measuring and analyzing carbon emissions from cloud usage, helping users understand their carbon impact.
- Kube Green: A simple Kubernetes add-on that automatically powers down selected resources when they are not in use.
In this article, I will discuss a microservices use case where a Spring Boot application is deployed on AWS EKS, and the monitoring of Green IT metrics is visualized through Grafana. Below are detailed explanations and steps to achieve this use case.
- First, we will create a Spring application for loan management and store it in AWS Elastic Container Registry (ECR).
- Next, we will set up an AWS Elastic Kubernetes Service (EKS) cluster to provide the necessary environment on AWS.
- Then, we will deploy the loan application on AWS EKS and open a public endpoint for access.
- After that, we will install and run Kepler in the AWS EKS cluster.
- We will configure Prometheus and Grafana to collect logs from both the application and Kepler.
- Finally, we will create a Grafana dashboard with different panels using PromQL to display Green IT metrics.
Pre-requisites
- Java 17+
- any IDE
- AWS login Credentials
- access to the internet
First, we will create a Spring application for loan management and store it in AWS Elastic Container Registry (ECR).
- Clone the repo from https://github.com/uday160386/app-greenit-metrics.git
- Build the application using the command below and run locally
  mvn clean package
  java -jar target/metrics-api-*.jar
- Access the application url: http://localhost:8080 from browser/postman and proceed if response is SUCCESS
- Create AWS ECR using
aws ecr create-repository --repository-name <app name> - Authenticate Docker to ECR
aws ecr get-login-password --region <region> | docker login --username AWS --password-stdin <aws_account_id>.dkr.ecr.<region>.amazonaws.com Replace: <aws_account_id> with your 12-digit AWS Account - Build and Tag docker image and Push it to ECR Note: sample docker file is available at https://github.com/uday160386/app-greenit-metrics/blob/main/Dockerfile
docker build -t <app name> .
docker tag <app name>:latest <aws_account_id>.dkr.ecr.<region>.amazonaws.com/<app name>:latest
docker push <aws_account_id>.dkr.ecr.<region>.amazonaws.com/<app name>:latest
Next, we will set up an AWS Elastic Kubernetes Service (EKS) cluster to provide the necessary environment on AWS.
- Create a an AWS Cluster by following
- Create an IAM role for EKS.
- Use eksctl (recommended):
eksctl create cluster --name <cluster name> --region <region> --nodes 2 - Update kubeconfig:
aws eks update-kubeconfig --name <cluster name>
Then, we will deploy the loan application on AWS EKS and open a public endpoint for access.
To deploy the loans application to EKS, we need to define
- deployment.yaml
- service.yaml
- configmap.yaml
Note: example files are available in the repo https://github.com/uday160386/app-greenit-metrics
Run the commands below to deploy workloads in EKS from the local environment:
Configmap.yaml
kubectl apply -f eks-configmap.yaml
Deployment.yaml
- Pulling image from ECR
- Exposing port defined is 8080
- Replcias defined as 2

kubectl apply -f eks-deployment.yaml
Service.yaml
kubectl apply -f eks-service.yaml

Note: selected internet-facing scheme for load balance to expose api as public
service.beta.kubernetes.io/aws-load-balancer-scheme: internet-facing
Getting External-url to access loans services, to get the info run
kubectl get svc <service-name>

NAME         TYPE           CLUSTER-IP      EXTERNAL-IP      PORT(S)        AGE
<service name>   LoadBalancer   10.100.210.50   <pending>        80:31234/TCP   1m
After that, we will install and run Kepler in the AWS EKS cluster.
What is Kepler?
From Kepler website: Kepler (Kubernetes-based Efficient Power Level Exporter) is a Prometheus exporter that measures energy consumption at the container, pod, VM, and process level by reading hardware sensors and attributing power based on resource utilization.
Install Kepler using yaml
Run the below yaml file within cluster. This will deploy Kepler as a DaemonSet in your cluster, and it will start collecting resource and energy metrics.
  kubectl apply -f kepler-daemonset.yaml
  https://github.com/uday160386/app-greenit-metrics/blob/main/kepler-daemonset.yaml

  kubectl apply -f kepler-service.yaml
  https://github.com/uday160386/app-greenit-metrics/blob/main/kepler-service.yaml
Run the below commands to get the external url to access the Kepler. Kepler service is available at port 9100
  kubectl get svc <service-name>
  NAME         TYPE           CLUSTER-IP      EXTERNAL-IP      PORT(S)        AGE
  <service name>   LoadBalancer   10.100.210.50   <pending>        80:31234/TCP   1m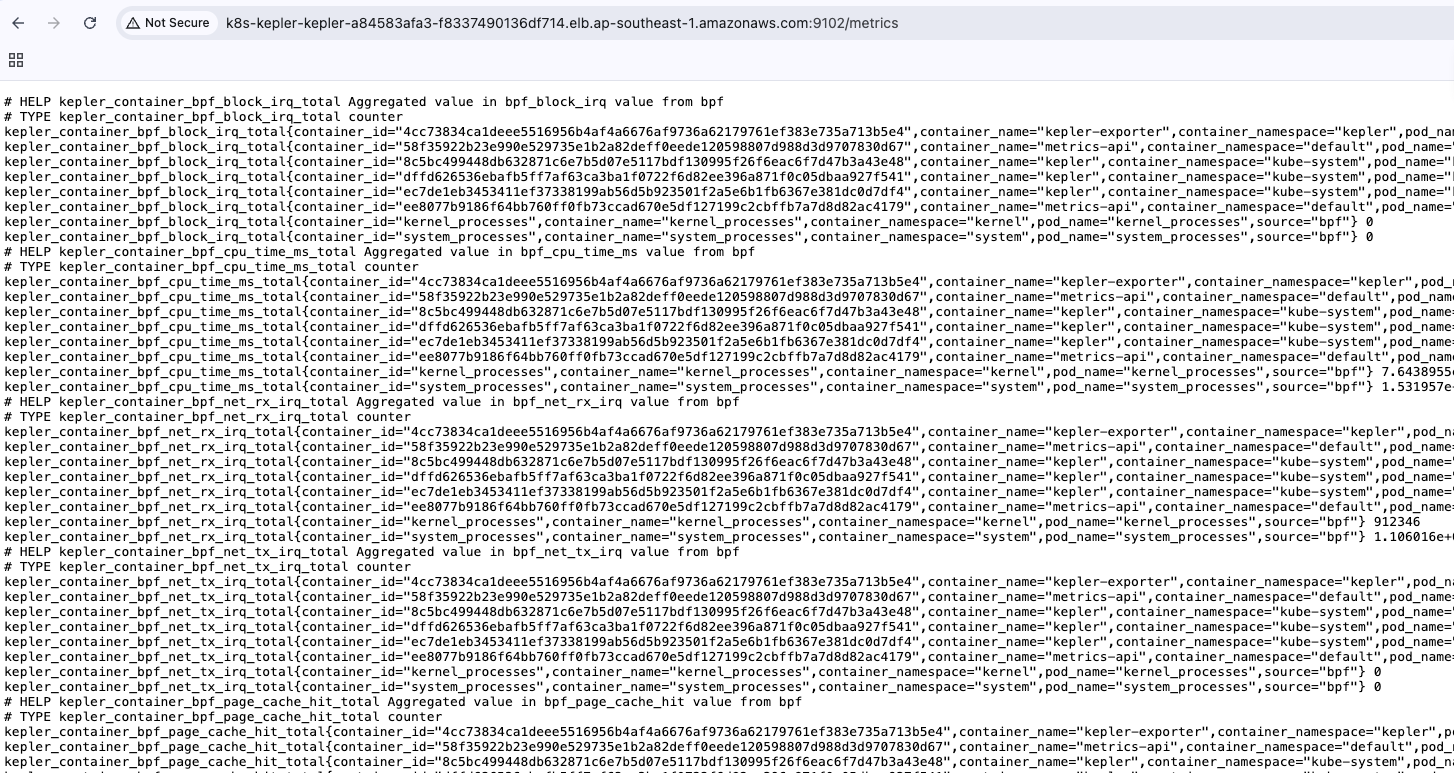
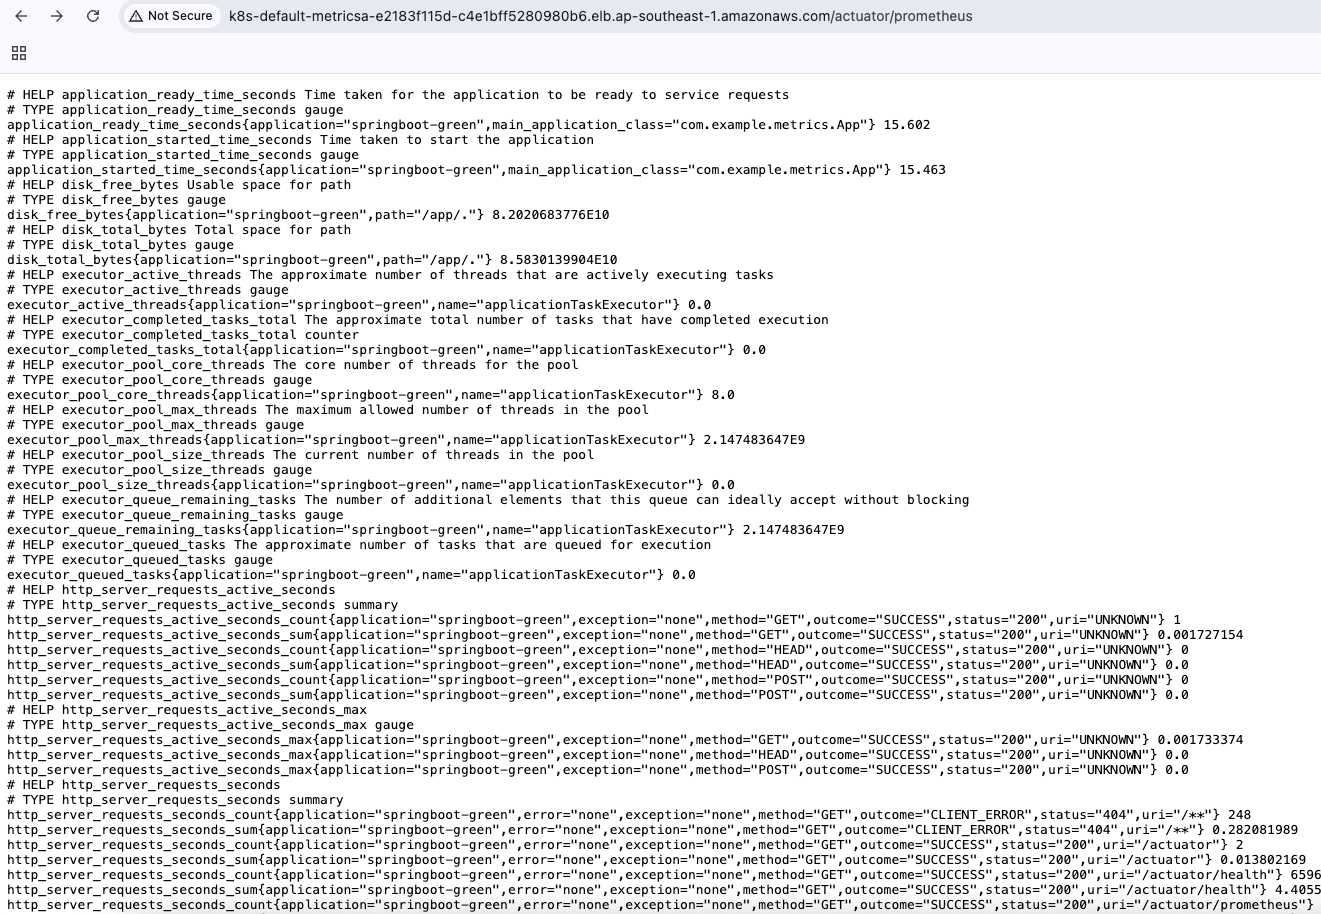
We will configure Prometheus and Grafana to collect logs from both the application and Kepler.
For someone new:
- Prometheus is the data source — it scrapes and stores metrics.
- Grafana is the visualization layer — it queries Prometheus using PromQL.
Make sure Prometheus/Grafana is running locally or in any cloud. If not, try running locally using the following steps:
Prometheus:
Download Prometheus: Go to Prometheus Downloads and grab the latest release for your OS. For example on Linux:
wget https://github.com/prometheus/prometheus/releases/download/v2.54.1/prometheus-2.54.1.linux-amd64.tar.gz tar xvf prometheus-2.54.1.linux-amd64.tar.gz cd prometheus-2.54.1.linux-amd64Download prometheus.yml from https://github.com/uday160386/app-greenit-metrics/blob/main/src/main/resources/prometheus.yml
This file contians configuration for application logs and kepler logs as well and replace the public endpoint (or) Install Prometheus via Helm Default installation helm install prometheus prometheus-community/prometheus –namespace monitoring
Start Prometheus:
./prometheus --config.file=prometheus.yml
Prometheus UI available at: http://localhost:9090
Grafana:
Run Grafana container:
docker run -d -p 3000:3000 --name=grafana grafana/grafanaAccess the UI: Open http://localhost:3000 in your browser.
Login credentials:
User: admin Password: admin (you’ll be prompted to change it on first login)
or via Helm:
  helm install grafana grafana/grafana --namespace monitoring
  kubectl get svc -n monitoring
Finally, we will create a Grafana dashboard with different panels using PromQL to display Green IT metrics.
Note:Kepler providing a default grafana dashboard. Download as below and upload the json file into Grafana.
curl -O https://raw.githubusercontent.com/sustainable-computing-io/kepler-operator/v1alpha1/hack/dashboard/assets/kepler/dashboard.json
1. Add Prometheus as a data source in Grafana
- Open Grafana in your browser.
- Create a new Dashboard and select the data source as Prometheus
- Configure Prometheus url , for instance localhost:9090
2. Define variables
- Create variables (Dashboard settings → Variables):
- $namespace (Custom): e.g., default (K8s only)
- $container (Textbox or Query): default your app’s container regexp, e.g., .spring.
- $app (Constant): springboot-green (matches management.metrics.tags.application)
- $pue (Constant): e.g., 1.2
- $ci_g_per_kwh (Constant): grid carbon intensity in gCO2e/kWh for your region (e.g., 400). You can start as a constant and refine later.
3. What you’ll measure?
- Energy & power at container/process level → from Kepler (K8s).
- Work (R) from your app → HTTP request counts.
- CO2e = energy × grid carbon intensity × PUE; optionally add embodied carbon (M) per SCI.
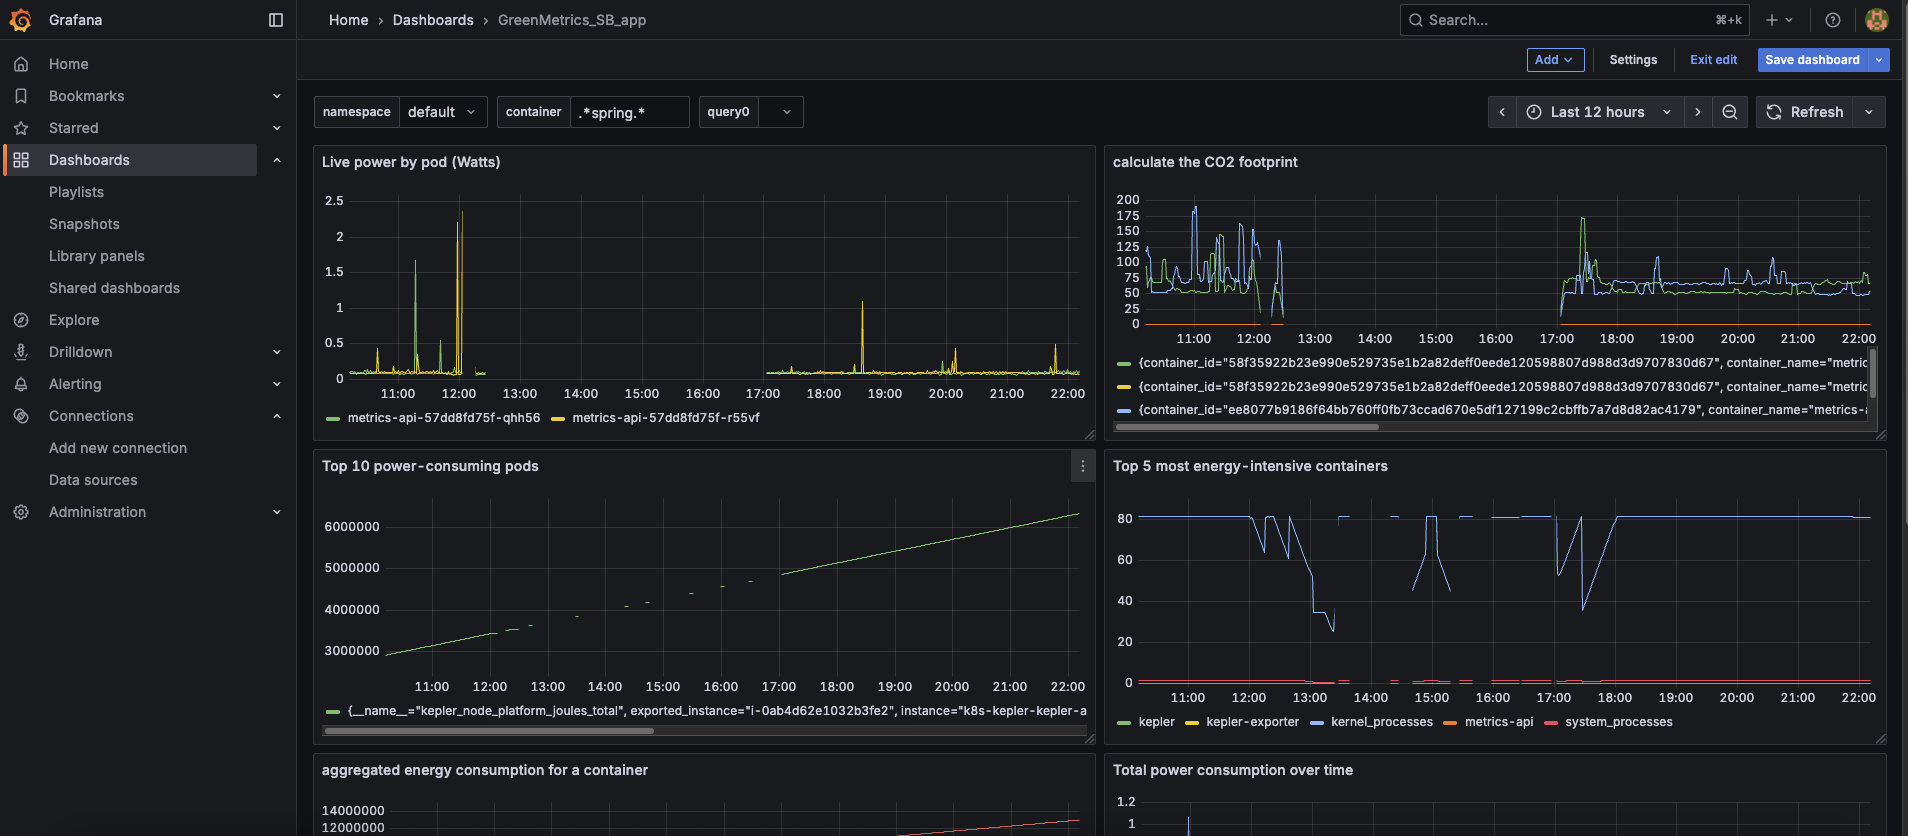
- Live power by pod (Watts)
- Top 10 power-consuming pods
- Top 5 most energy-intensive containers
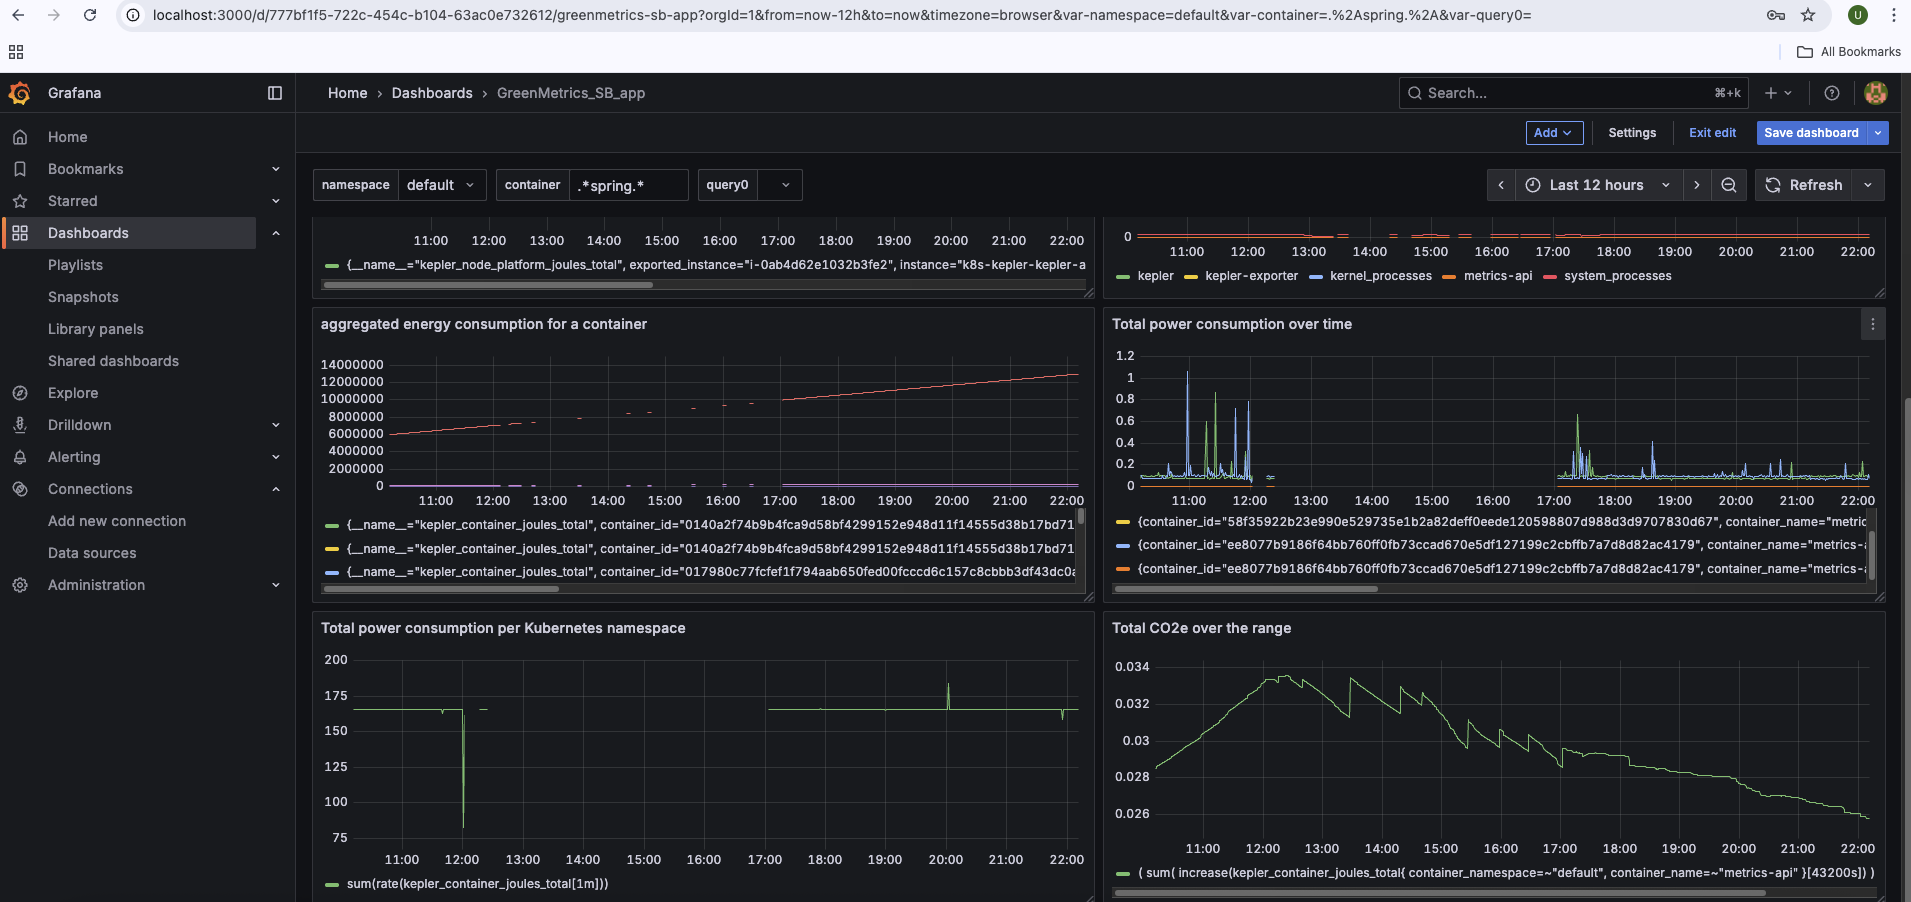
- Aggregated energy consumption for a container
- Total power consumption over time
- Total power consumption per Kubernetes namespace
4. Build the core panels (PromQL) to visualize Green IT Metrics:
- Live power by pod (Watts) : If you want power consumption (Watts) per pod, this query is good.
sum by (pod_name) ( irate(kepler_container_joules_total{ container_namespace=~"default", container_name=~"metrics-api" }[$__rate_interval]) ) - Calculate the CO2 footprint: It estimates the energy cost (per container, namespace, or aggregated group) in your default namespace
(rate(kepler_container_joules_total{container_namespace="default"}[5m]) / 1000 * 3600) * 200 - Top 10 power-consuming pods: power consumption in Watts (W) per pod
topk(10, kepler_pod_power_total) - Top 5 most energy-intensive containers: 5 containers with the highest average power consumption (Watts) over the last hour, grouped by container name.
topk(5, avg by (container_name) (rate(kepler_container_joules_total[1h]))) - Aggregated energy consumption for a container
kepler_container_joules_total - Total power consumption over time
rate(kepler_container_joules_total{container_name="metrics-api"}[$__interval]) - Total power consumption per Kubernetes namespace
sum(rate(kepler_container_joules_total[$__interval])) - Total CO2e over the range: this query gives the estimated cost (or scaled energy impact) of running the metrics-api containers in the default namespace, over the selected Grafana time range.
  (
sum(
  increase(kepler_container_joules_total{
    container_namespace=~"default",
    container_name=~"metrics-api"
  }[$__range])
) / 3.6e6
  ) * $pue * 10
4. Visualize the consumption of carbon foot print for your spring boot applicaiton:
With this in place you’ll see live power (W), energy (kWh), total CO2e (g), and gCO2e per request in Grafana for your Spring Boot app—aligned to the SCI method.
Source is available at : app-greenit-metrics